预先准备
- minikube For Windows(资源充足, 有集群更好不过);
- Helm;
- 科学上网能力.
整体框架
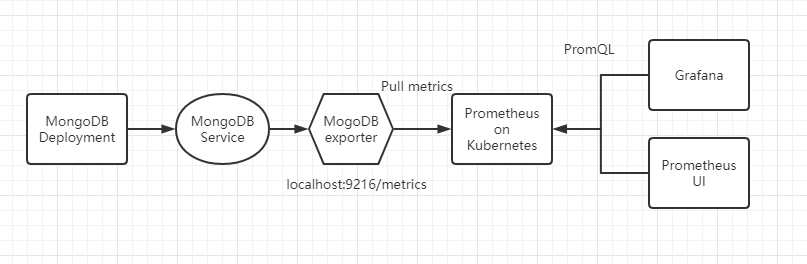
随手在线画的, 不美观, qwq.
操作步骤
启用helm-tiller(helm服务器端)
在minikube中启用helm-tiller插件, 很简单, 只需要一条命令即可:
1
2
3
| $ minikube addons enable helm-tiller
# 或者在启动 minikube 的时候直接启用 helm-tiller
$ minikube start --addons=["helm-tiller"] <Other_Options>
|
安装Prometheus-operator
首先添加所需仓库:
1
2
3
| $ helm repo add prometheus-community https://prometheus-community.github.io/helm-charts
# 更新仓库内容
$ helm repo update
|
安装/下载chart:
1
2
3
4
5
6
| $ helm install prometheus-community/kube-prometheus-stack --version 9.4.10
# 或者先下载下来更改所需内容之后再进行安装(推荐使用方法)
$ helm pull prometheus-community/kube-prometheus-stack --version 9.4.10 --untar
# 安装
$ helm install prometheus kube-prometheus-stack/
|
安装完成之后, kubernetes会自动接管后续工作, 如拉取镜像等:
 1
 2
 3
 4
 5
 6
 7
 8
 9
10
11
12
13
14
15
16
17
18
19
20
21
| # 观察部署进度
$ kubectl get po -w
NAME READY STATUS RESTARTS AGE
alertmanager-prometheus-kube-prometheus-alertmanager-0 2/2 Running 0 24m
prometheus-grafana-79b677fd4b-t9kr9 2/2 Running 0 25m
prometheus-kube-prometheus-operator-69cd74c99f-wltf4 2/2 Running 0 25m
prometheus-kube-state-metrics-95d956569-mlfwv 1/1 Running 0 25m
prometheus-prometheus-kube-prometheus-prometheus-0 3/3 Running 1 24m
prometheus-prometheus-node-exporter-tvwf5 1/1 Running 0 25m
# 查看service
$ kubectl get svc
NAME TYPE CLUSTER-IP EXTERNAL-IP PORT(S) AGE
alertmanager-operated ClusterIP None <none> 9093/TCP,9094/TCP,9094/UDP 25m
kubernetes ClusterIP 10.96.0.1 <none> 443/TCP 44h
prometheus-grafana ClusterIP 10.108.199.68 <none> 80/TCP 26m
prometheus-kube-prometheus-alertmanager ClusterIP 10.96.81.7 <none> 9093/TCP 26m
prometheus-kube-prometheus-operator ClusterIP 10.109.9.111 <none> 8080/TCP,443/TCP 26m
prometheus-kube-prometheus-prometheus ClusterIP 10.98.173.241 <none> 9090/TCP 26m
prometheus-kube-state-metrics ClusterIP 10.109.121.40 <none> 8080/TCP 26m
prometheus-operated ClusterIP None <none> 9090/TCP 25m
prometheus-prometheus-node-exporter ClusterIP 10.107.29.93 <none> 9100/TCP 26m
|
以上信息无误则表明prometheus已成功部署.
使用minikube(kubectl亦可)的转发功能, 将svc/prometheus-kube-prometheus-prometheus 的端口映射到本地:
1
2
3
4
| $ minikube port-forward svc/prometheus-kube-prometheus-prometheus 9090
Forwarding from 127.0.0.1:9090 -> 9090
Forwarding from [::1]:9090 -> 9090
Handling connection for 9090
|
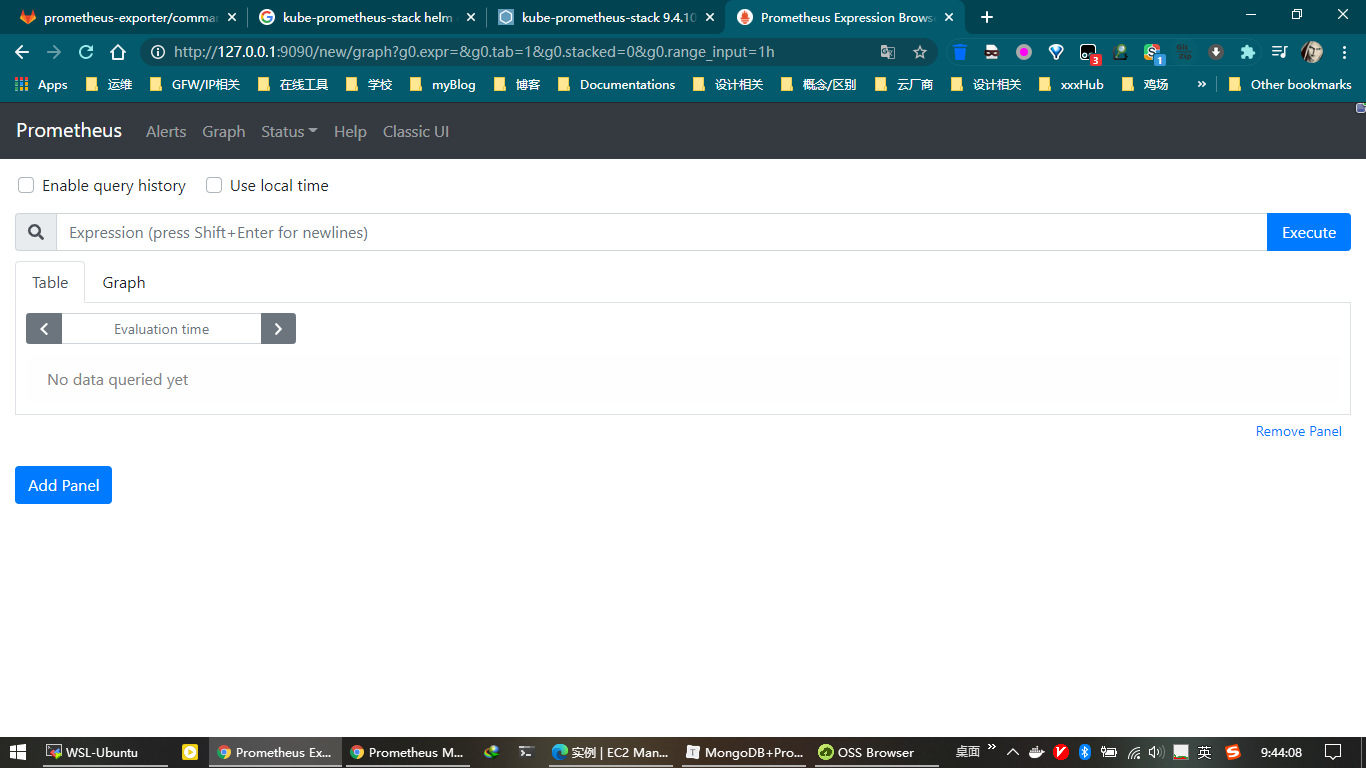
打开浏览器访问http://127.0.0.1:9090/查看prometheus UI:
使用以下命令查看prometheus的servicemonitor(其对应prometheus UI中的target):
 1
 2
 3
 4
 5
 6
 7
 8
 9
10
11
12
13
14
15
| $ kubectl get servicemonitor
NAME AGE
prometheus-kube-prometheus-alertmanager 36m
prometheus-kube-prometheus-apiserver 36m
prometheus-kube-prometheus-coredns 36m
prometheus-kube-prometheus-grafana 36m
prometheus-kube-prometheus-kube-controller-manager 36m
prometheus-kube-prometheus-kube-etcd 36m
prometheus-kube-prometheus-kube-proxy 36m
prometheus-kube-prometheus-kube-scheduler 36m
prometheus-kube-prometheus-kube-state-metrics 36m
prometheus-kube-prometheus-kubelet 36m
prometheus-kube-prometheus-node-exporter 36m
prometheus-kube-prometheus-operator 36m
prometheus-kube-prometheus-prometheus 36m
|
查看所有crd:
1
2
3
4
5
6
7
8
| $ kubectl get crd
NAME CREATED AT
alertmanagers.monitoring.coreos.com 2020-10-08T01:10:04Z
podmonitors.monitoring.coreos.com 2020-10-08T01:10:04Z
prometheuses.monitoring.coreos.com 2020-10-08T01:10:04Z
prometheusrules.monitoring.coreos.com 2020-10-08T01:10:04Z
servicemonitors.monitoring.coreos.com 2020-10-08T01:10:04Z
thanosrulers.monitoring.coreos.com 2020-10-08T01:10:04Z
|
通过describe子命令可以发现crd的matchLabels都包含release: prometheus标签.
部署MongoDB及其服务
参考MongoDB-depl-svc.yaml文件内容如下:
 1
 2
 3
 4
 5
 6
 7
 8
 9
10
11
12
13
14
15
16
17
18
19
20
21
22
23
24
25
26
27
28
29
30
31
32
33
| apiVersion: apps/v1
kind: Deployment
metadata:
name: mongodb-deployment
labels:
app: mongodb
spec:
replicas: 2
selector:
matchLabels:
app: mongodb
template:
metadata:
labels:
app: mongodb
spec:
containers:
- name: mongodb
image: mongo
ports:
- containerPort: 27017
---
apiVersion: v1
kind: Service
metadata:
name: mongodb-service
spec:
selector:
app: mongodb
ports:
- protocol: TCP
port: 27017
targetPort: 27017
|
按需进行修改, 修改完成之后应用配置清单:
1
| $ kubectl apply -f MongoDB-depl-svc.yaml
|
等待MongoDB部署完成…
1
2
3
| $ kubectl get deployment/mongodb-deployment -w
NAME READY UP-TO-DATE AVAILABLE AGE
mongodb-deployment 2/2 2 0 3m13s
|
部署MongoDB Exporter
添加helm repo:
1
2
| $ helm repo add prometheus-community https://prometheus-community.github.io/helm-charts
$ helm repo update
|
下载chart:
1
| $ helm pull prometheus-community/prometheus-mongodb-exporter --untar
|
修改value.yaml文件内容:
 1
 2
 3
 4
 5
 6
 7
 8
 9
10
| ...
# 使用kubectl get svc获取MongoDB的服务及端口
mongodb:
uri: "mongodb://mongodb-service:27017"
...
# 从上面可以得知servicemonitor所匹配的标签 release: prometheus
serviceMonitor:
additionalLabels:
release: prometheus
...
|
应用chart:
1
| $ helm install mongodb-exporter prometheus-mongodb-exporter/
|
等待svc,pod部署完成之后, 映射mongodb-exporter, 检查/metrics:
1
| $ kubectl port-forward service/mongodb-exporter-prometheus-mongodb-exporter 9216
|
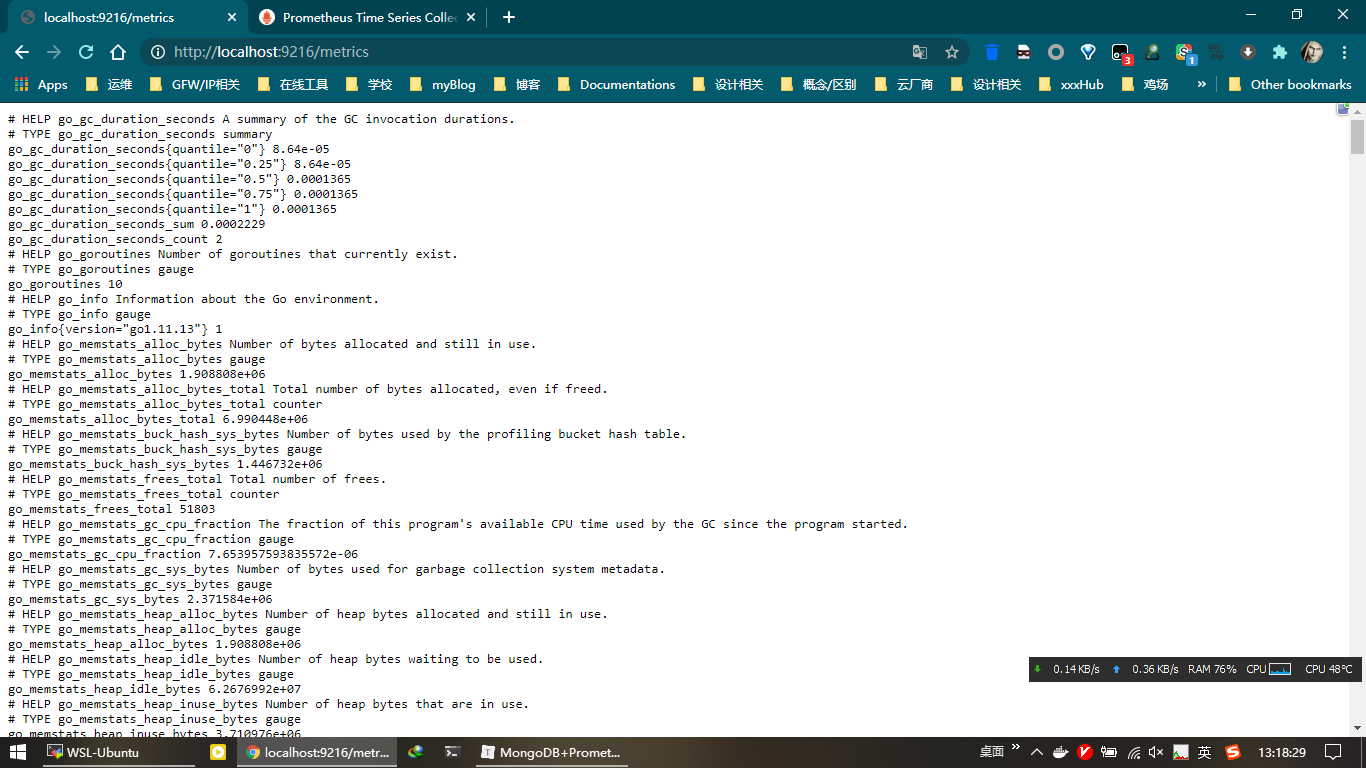
打开浏览器访问http://localhost:9216/metrics进行查看:
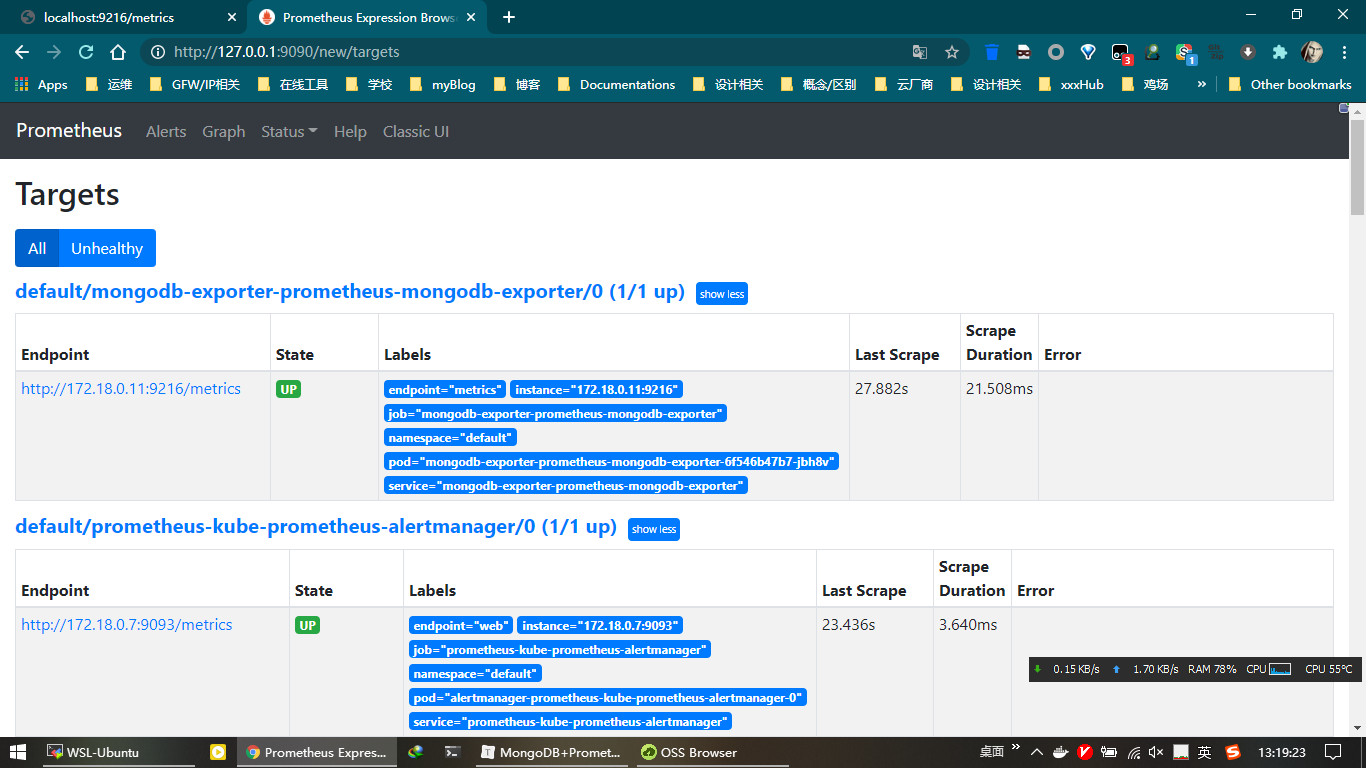
此时, 再打开prometheus UI查看target可以看到mongodb-exporter已经处于UP状态:
在Grafana查看
1
| $ kubectl port-forward deployment/prometheus-grafana 3000
|
打开浏览器访问http://localhost:3000:
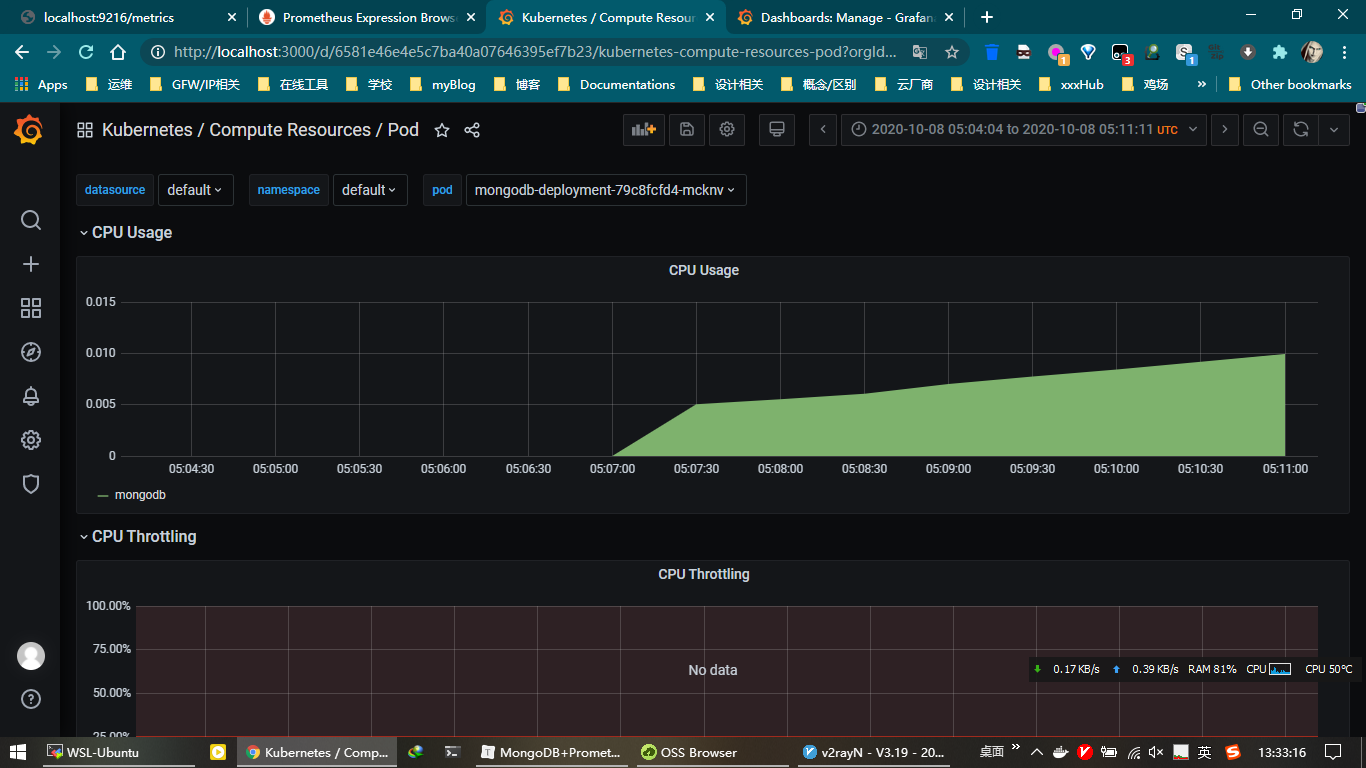
ℹ️默认账号admin, 默认密码prom-operator (从官方文档中即可获取)
附录1: chart 地址
上文中所使用的chart仓库地址:
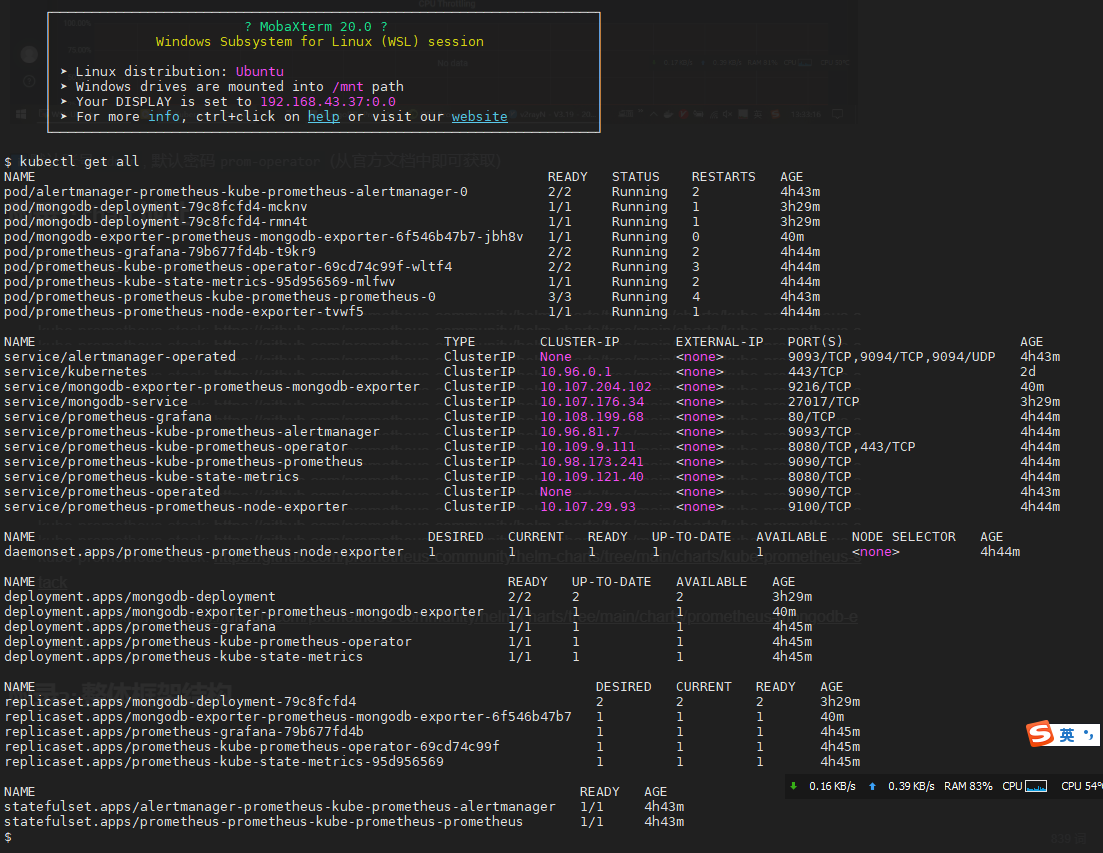
附录2: kubectl get all