
# Prometheus + AlertManager
# AlertManager 简介
Alertmanager 主要用于接收 Prometheus 发送的告警信息,它支持丰富的告警通知渠道,例如邮件、微信、钉钉、Slack 等常用沟通工具,而且很容易做到告警信息进行去重,降噪,分组等,是一款很好用的告警通知系统。
# 配置 node-exporter 和 Prom
# 配置 node-exporter
node-exporter是最基本的节点监控客户端,负责监控机器的各个指标,包括节点存活、CPU、Mem、Network、IO 等等,方便后边演示 Alertmanager报警时的触发条件,例如配置节点存活检测,当机器 Down 时,触发报警控制,那么就可以通过停止 node-exporter 来模拟实现.
所以直接启动即可:
docker run --name node-exporter -d -p 9100:9100 prom/node-exporter
访问测试:http://localhost:9100
# 配置 Prom
编辑 Prometheus 配置文件prometheus.yml:
global:
  scrape_interval:     15s
  evaluation_interval: 15s
  # scrape_timeout is set to the global default (10s).

# -------------------------------------
# Alertmanager configuration
alerting:
  alertmanagers:
  - static_configs:
    - targets:
      - 172.16.1.132:9093

rule_files:
  - "/etc/prometheus/rules/*.rules"
# -------------------------------------

scrape_configs:
  - job_name: 'prometheus'
    static_configs:
    - targets: ['172.16.1.132:9090']
      labels:
        instance: prometheus
        service: prometheus-service

  - job_name: 'node-exporter'
    file_sd_configs:		# 使用该模块动态装载,而无需每次重启prom服务
      - files: ['/etc/prometheus/nodes/*.json']
2
3
4
5
6
7
8
9
10
11
12
13
14
15
16
17
18
19
20
21
22
23
24
25
26
27
28
创建node-exporter.json,内容如下所示:
[
    {
        "targets": [
            "172.16.1.132:9100"
        ],
        "labels": {
            "instance": "vm-172.16.1.132",
            "service": "node-service"
        }
    }
]
2
3
4
5
6
7
8
9
10
11
启动 Prom 容器:
docker run -d --name prometheus -p 9090:9090 -v /home/prom/prometheus.yml:/etc/prometheus/prometheus.yml -v /home/prom/nodes/:/etc/prometheus/nodes/ prom/prometheus
查看node-exporter和prometheus健康状况:http://localhost:9090/targets
# 配置 AlertManager
简单启动AlertManager:
docker run --name alertmanager -d -p 9093:9093 prom/alertmanager
打开浏览器访问 http://lcoalhost:9093 进行测试,这里没有报警规则,所有没有内容呈现,
编辑 AlertManager 的配置文件alertmanager.yml:
global:			# 全局设置
  resolve_timeout: 5m
  smtp_from: 'dai15628960878@163.com'
  smtp_smarthost: 'smtp.163.com:465'		# 163邮箱的SMTP SSL端口为465/994,非SSL为25
  smtp_auth_username: 'dai15628960878@163.com'
  smtp_auth_password: 'xxxxxxxxxxxxxxx'
  smtp_require_tls: false		# 是否需要tls验证
  smtp_hello: '163.com'
route:
  group_by: ['alertname']
  group_wait: 5s
  group_interval: 5s
  repeat_interval: 5m
  receiver: 'email'
receivers:
- name: 'email'
  email_configs:
  - to: 'agou-ops@foxmail.com'
    send_resolved: true
inhibit_rules:
  - source_match:
      severity: 'critical'
    target_match:
      severity: 'warning'
    equal: ['alertname', 'dev', 'instance']
2
3
4
5
6
7
8
9
10
11
12
13
14
15
16
17
18
19
20
21
22
23
24
25
启动容器:
docker run -d --name alertmanager -p 9093:9093 -v /home/prom/alertmanager.yml:/etc/alertmanager/alertmanager.yml -v /home/prom/rules/:/etc/prometheus/rules/ prom/alertmanager
# 配置 Prom 的报警规则
在 Prometheus 配置 AlertManager 服务地址以及告警规则,新建报警规则文件/home/prom/rules/ test_alert.rules 如下:
groups:
- name: node-up
  rules:
  - alert: node-up
    expr: up{job="node-exporter"} == 0
    for: 15s
    labels:
      severity: 1
      team: node
    annotations:
      summary: "【【 $labels.instance 】】 已停止运行超过 15s!"
2
3
4
5
6
7
8
9
10
11
然后,修改 prometheus.yml 配置文件,添加 rules 规则文件,内容如下(上面已经修改过):
...
# Alertmanager configuration
alerting:
  alertmanagers:
  - static_configs:
    - targets:
      - 172.16.1.132:9093

rule_files:
  - "/etc/prometheus/rules/*.rules"
...
2
3
4
5
6
7
8
9
10
11
启动容器:
docker run -d --name prometheus -p 9090:9090 -v /home/prom/prometheus.yml:/etc/prometheus/prometheus.yml -v /home/prom/nodes/:/etc/prometheus/nodes/ -v /home/prom/rules/:/etc/prometheus/rules/ prom/prometheus
查看报警规则rules:

这里说明一下 Prometheus Alert 告警状态有三种状态:Inactive、Pending、Firing
Inactive:非活动状态,表示正在监控,但是还未有任何警报触发。Pending:表示这个警报必须被触发。由于警报可以被分组、压抑/抑制或静默/静音,所以等待验证,一旦所有的验证都通过,则将转到 Firing 状态。Firing:将警报发送到 AlertManager,它将按照配置将警报的发送给所有接收者。一旦警报解除,则将状态转到 Inactive,如此循环。
手动停掉node-exporter容器,测试触发警告:
docker stop node-exporter
在 Prom web面板中查看:

在alertmanagerweb面板中查看:

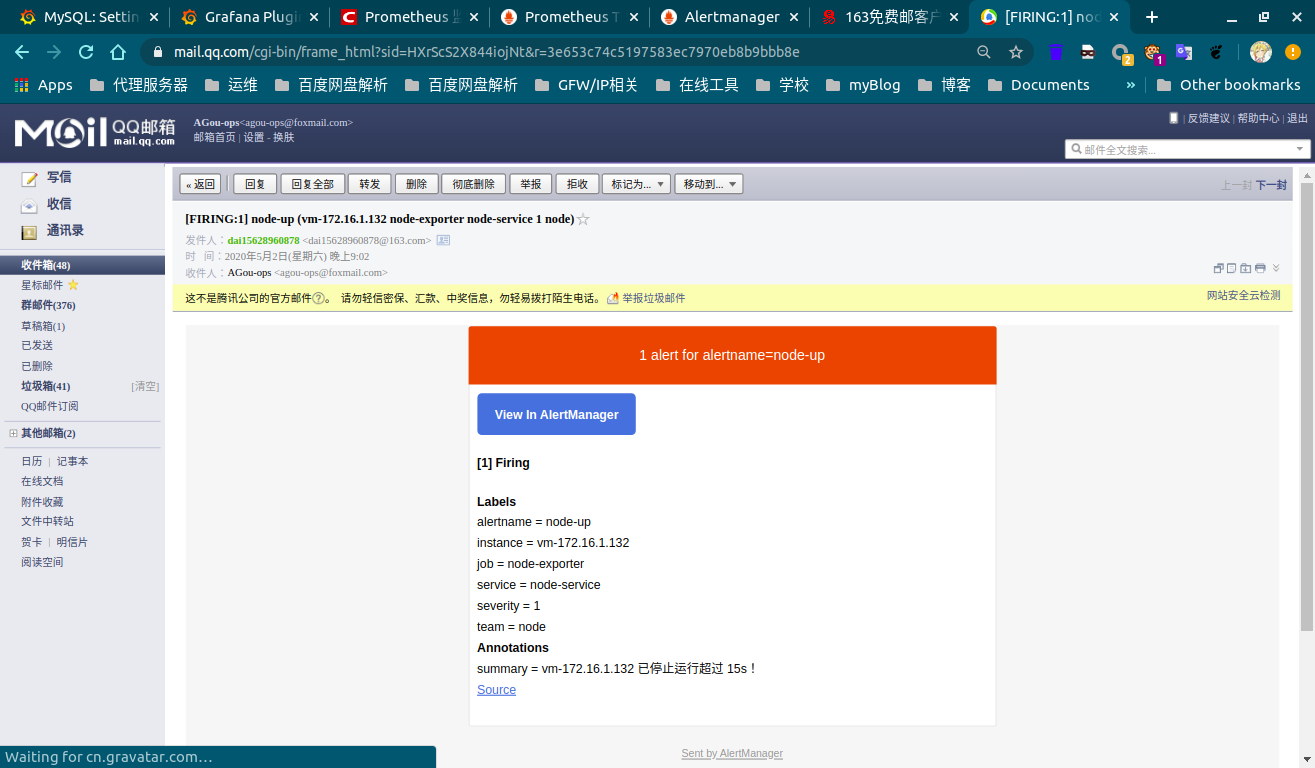
已成功收到报警邮件:
# 参考链接
- alert configuration:https://prometheus.io/docs/alerting/configuration/
- 动态config文件:https://prometheus.io/docs/prometheus/latest/configuration/configuration/#scrape_config