Appearance
Grafana Loki
简介
Loki 是 Grafana Labs 团队最新的开源项目,是一个水平可扩展,高可用性,多租户的日志聚合系统。它的设计非常经济高效且易于操作,因为它不会为日志内容编制索引,而是为每个日志流配置一组标签。项目受 Prometheus 启发,官方的介绍就是:Like Prometheus, but for logs,类似于 Prometheus 的日志系统。
Loki 架构

Distributor: 负责客户端处理传入的数据流。这是日志数据写入路径中的第一站。分发者收到一组流后,将验证每个流的正确性并确保其在配置的租户(或全局)限制之内。然后,将有效块拆分为多个批次 ,并并行发送到多个ingester。Ingester: 负责将路径上的日志数据写入到长期存储后端(DynamoDB,S3,Cassandra等)并返回日志数据在内存中查询读取路径上。Querier: 查询器服务处理查询使用LogQL查询语言,抓取日志ingesters和长期存储。index&chunks: Loki分成两种存储,一种叫Index(索引),一种叫Chunk(块)。通过命名可以很清晰地明白index为日志的索引存储,而Chunk为日志的内容存储。查询的时候是按照先找索引再找到具体的chunk存储。
Loki 部署
install Loki with Docker or Docker-compose
详情参考: https://grafana.com/docs/loki/latest/installation/docker/
以下仅记录关键命令:
# 使用docker
wget https://raw.githubusercontent.com/grafana/loki/v1.6.0/cmd/loki/loki-local-config.yaml -O loki-config.yaml
docker run -v $(pwd):/mnt/config -p 3100:3100 grafana/loki:1.6.0 -config.file=/mnt/config/loki-config.yaml
wget https://raw.githubusercontent.com/grafana/loki/v1.6.0/cmd/promtail/promtail-docker-config.yaml -O promtail-config.yaml
docker run -v $(pwd):/mnt/config -v /var/log:/var/log grafana/promtail:1.6.0 -config.file=/mnt/config/promtail-config.yaml

# 使用docker-compose
wget https://raw.githubusercontent.com/grafana/loki/v1.6.0/production/docker-compose.yaml -O docker-compose.yaml
docker-compose -f docker-compose.yaml up
安装完成之后打开浏览器访问: http://127.0.0.1:3000 进入Grafana面板, 输入默认账号密码admin/admin.
添加Loki数据源:
- 打开
Grafana UI并登录, 依次点击
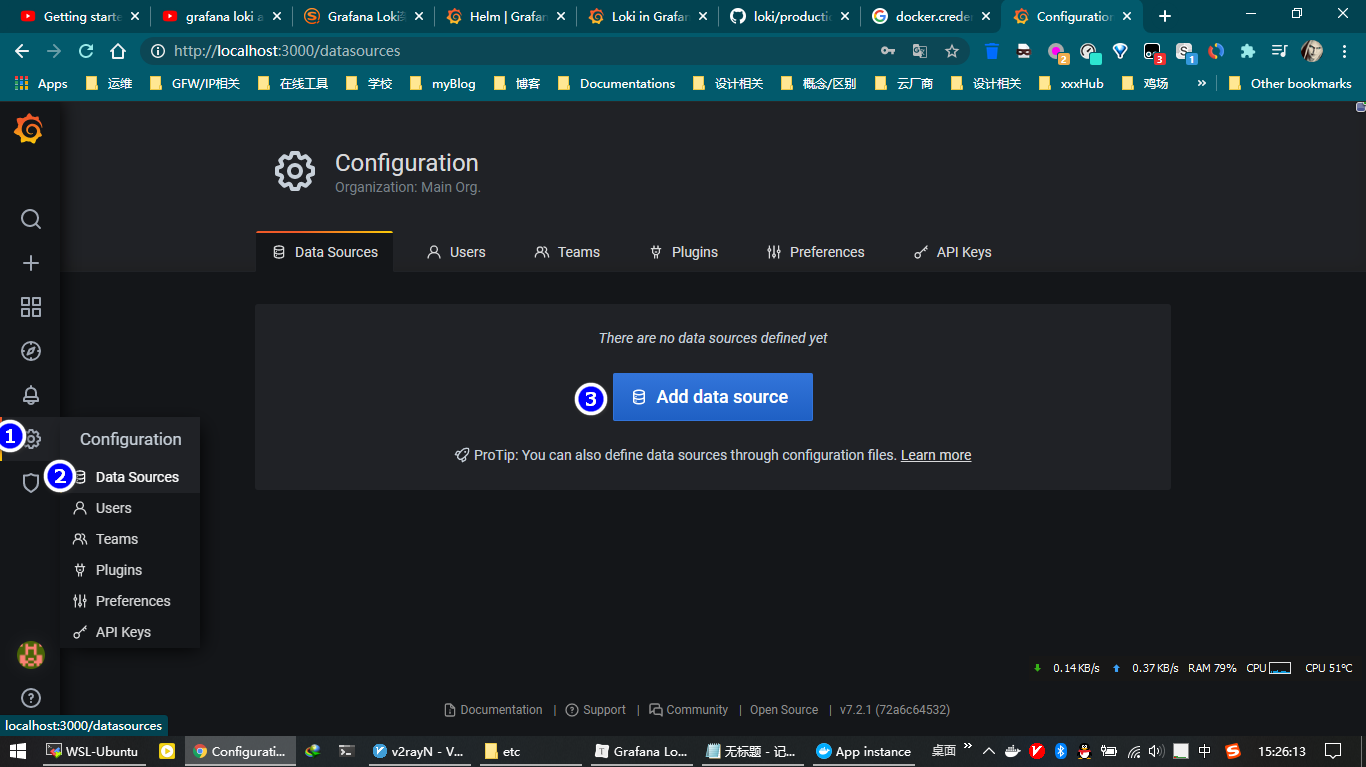
- 在列表中找到
Loki并点击 - 添加URL为
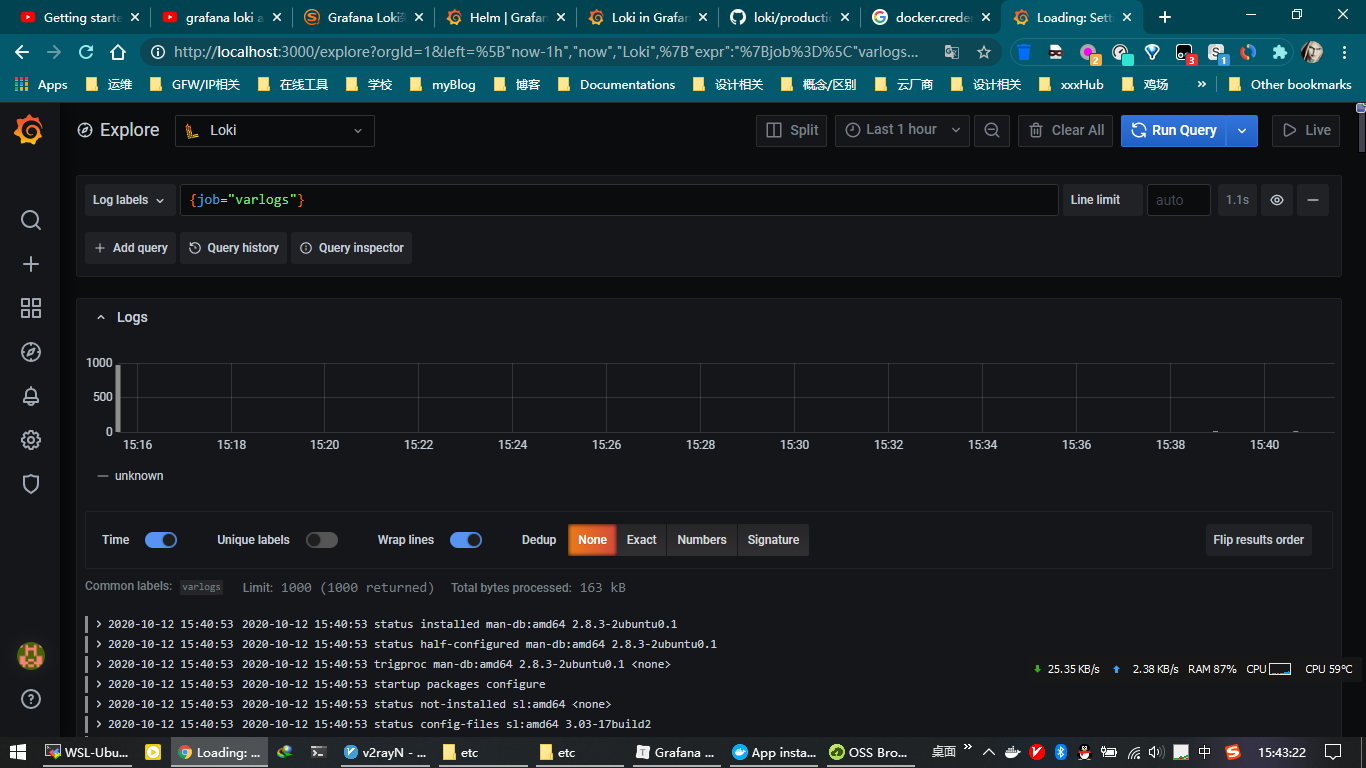
http://127.0.0.1:3100(如果使用的是docker-compose部署, 则需要填写的URL为http://loki:3100), 然后点击Save & Test即可 - 点击左侧列表中的
Explore, 选择一个数据流
install Loki with Helm
详情参考: https://grafana.com/docs/loki/latest/installation/helm/
以下仅记录关键命令:
# 添加loki仓库
helm repo add loki https://grafana.github.io/loki/charts
# 升级仓库
helm repo update
# Deploy in a custom namespace
helm upgrade --install loki --namespace=loki loki/loki
# Deploy Loki Stack (Loki, Promtail, Grafana, Prometheus) with persistent volume claim
helm upgrade --install loki loki/loki-stack  --set grafana.enabled=true,prometheus.enabled=true,prometheus.alertmanager.persistentVolume.enabled=false,prometheus.server.persistentVolume.enabled=false,loki.persistence.enabled=true,loki.persistence.storageClassName=standard,loki.persistence.size=5Gi
# Deploy Grafana to your cluster
helm install stable/grafana -n loki-grafana
# 获取grafana密码
kubectl get secret --namespace <YOUR-NAMESPACE> loki-grafana -o jsonpath="{.data.admin-password}" | base64 --decode ; echo
# 运行grafana UI
kubectl port-forward --namespace <YOUR-NAMESPACE> service/loki-grafana 3000:80
随后打开浏览器访问: http://127.0.0.1:3000
示例promtail文件
静态标签指定:
$ cat promtail-config.yaml
server:
  http_listen_port: 9080
  grpc_listen_port: 0

positions:
  filename: /tmp/positions.yaml

clients:
  - url: http://loki:3100/loki/api/v1/push

scrape_configs:
- job_name: system
  static_configs:
  - targets:
      - localhost
    labels:		# 标签, 重要.
      job: varlogs
      __path__: /var/log/*log
使用客户端命令promtail传送日志到loki: promtail -config.file=promtail-local-config.yaml
动态标签定义:
...
# 使用pipeline_stages
- job_name: system
   pipeline_stages:
      - regex:
        expression: "^(?P<ip>\\S+) (?P<identd>\\S+) (?P<user>\\S+) \\[(?P<timestamp>[\\w:/]+\\s[+\\-]\\d{4})\\] \"(?P<action>\\S+)\\s?(?P<path>\\S+)?\\s?(?P<protocol>\\S+)?\" (?P<status_code>\\d{3}|-) (?P<size>\\d+|-)\\s?\"?(?P<referer>[^\"]*)\"?\\s?\"?(?P<useragent>[^\"]*)?\"?$"
    - labels:
        action:
        status_code:
   static_configs:
   - targets:
      - localhost
     labels:
      job: apache
      env: dev
      __path__: /var/log/apache.log
LogQL
Log Query Language, 用于查询和筛选grafana loki数据.
Log Stream Selector
=: exactly equal.!=: not equal.=~: regex matches.!~: regex does not match.Examples:
{name=~"mysql.+"}{name!~"mysql.+"}{name!~mysql-\d+}Filter Expression
|=: Log line contains string.!=: Log line does not contain string.|~: Log line matches regular expression.!~: Log line does not match regular expression.Examples:
{filename="/var/log/nginx/access.log"} |= "404": 查找有关404的日志信息
{filename="/var/log/nginx/access.log"} |~ "Mozilla/5.0.*": 使用正则表达式;
rate: calculates the number of entries per second
count_over_time: counts the entries for each log stream within the given range.
bytes_rate: calculates the number of bytes per second for each stream.
bytes_over_time: counts the amount of bytes used by each log stream for a given range.Examples
count_over_time({job="mysql"}[5m])count_over_time({job="mysql"}[5m])
Lokicli
使用命令行查看 LOGS
参考: https://grafana.com/docs/loki/latest/getting-started/logcli/
参考链接
- Loki Arch: https://grafana.com/docs/loki/latest/architecture/
- Loki installation: https://grafana.com/docs/loki/latest/installation/
- promtail pipelines: https://grafana.com/docs/loki/latest/clients/promtail/pipelines/
- promtail configuration: https://grafana.com/docs/loki/latest/clients/promtail/configuration/
- LogQL: https://grafana.com/docs/loki/latest/logql/#logql-log-query-language