Appearance
Prometheus 安装与部署、Grafana
Prometheus 简介
Prometheus受启发于Google的Brogmon监控系统(相似的Kubernetes是从Google的Brog系统演变而来),从2012年开始由前Google工程师在Soundcloud以开源软件的形式进行研发,并且于2015年早期对外发布早期版本。2016年5月继Kubernetes之后成为第二个正式加入CNCF基金会的项目,同年6月正式发布1.0版本。2017年底发布了基于全新存储层的2.0版本,能更好地与容器平台、云平台配合。
主要功能
- 多维 数据模型(时序由 metric 名字和 k/v 的 labels 构成)。
- 灵活的查询语句(PromQL)。
- 无依赖存储,支持 local 和 remote 不同模型。
- 采用 http 协议,使用 pull 模式,拉取数据,简单易懂。
- 监控目标,可以采用服务发现或静态配置的方式。
- 支持多种统计数据模型,图形化友好。
核心组件
- Prometheus Server, 主要用于抓取数据和存储时序数据,另外还提供查询和 Alert Rule 配置管理。
- client libraries,用于对接 Prometheus Server, 可以查询和上报数据。
- push gateway ,用于批量,短期的监控数据的汇总节点,主要用于业务数据汇报等。
- 各种汇报数据的 exporters ,例如汇报机器数据的 node_exporter, 汇报 MongoDB 信息的 MongoDB exporter 等等。
- 用于告警通知管理的 alertmanager 。
基础架构
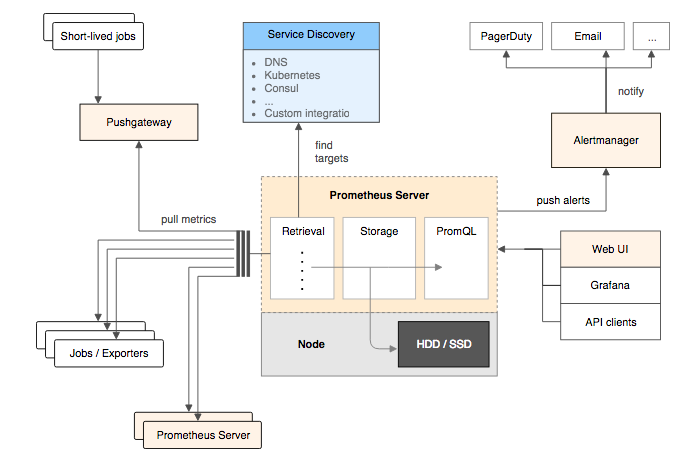
Prometheus Server是Prometheus组件中的核心部分,负责实现对监控数据的获取,存储以及查询。 Prometheus Server可以通过静态配置管理监控目标,也可以配合使用Service Discovery的方式动态管理监控目标,并从这些监控目标中获取数据。其次Prometheus Server需要对采集到的监控数据进行存储,Prometheus Server本身就是一个时序数据库,将采集到的监控数据按照时间序列的方式存储在本地磁盘当中。最后Prometheus Server对外提供了自定义的PromQL语言,实现对数据的查询以及分析。
Prometheus Server内置的Express Browser UI,通过这个UI可以直接通过PromQL实现数据的查询以及可视化。
Prometheus Server的联邦集群能力可以使其从其他的Prometheus Server实例中获取数据,因此在大规模监控的情况下,可以通过联邦集群以及功能分区的方式对Prometheus Server进行扩展。
它大致使用逻辑是这样:
- Prometheus server 定期从静态配置的 targets 或者服务发现的 targets 拉取数据。
- 当新拉取的数据大于配置内存缓存区的时候,Prometheus 会将数据持久化到磁盘(如果使用 remote storage 将持久化到云端)。
- Prometheus 可以配置 rules,然后定时查询数据,当条件触发的时候,会将 alert 推送到配置的 Alertmanager。
- Alertmanager 收到警告的时候,可以根据配置,聚合,去重,降噪,最后发送警告。
- 可以使用 API, Prometheus Console 或者 Grafana 查询和聚合数据。
下载并运行 Prom
- 为了安全起见,使用
prometheus用户来启动服务,首先创建这个用户:
groupadd prometheus
useradd -g prometheus -M -s /sbin/nologin prometheus
groupadd prometheus
useradd -g prometheus -M -s /sbin/nologin prometheus
- 从官方站点下载合适的包,并解压:
wget https://github.com/prometheus/prometheus/releases/download/v2.17.2/prometheus-2.17.2.linux-amd64.tar.gz
tar xf prometheus-2.17.2.linux-amd64.tar.gz -C /usr/share/
mv /usr/share/prometheus-2.17.2.linux-amd64 /usr/share/prometheus
mkdir -pv /usr/share/prometheus/data
chown -R prometheus.prometheus /usr/share/prometheus
cd /usr/share/prometheus
ℹ️ 官方下载站点:https://prometheus.io/download
- 创建 prometheus 系统服务启动文件
/usr/lib/systemd/system/prometheus.service:
[Unit]
Description=Prometheus Server
Documentation=https://prometheus.io/docs/introduction/overview/
After=network-online.target

[Service]
User=prometheus
Restart=on-failure

#Change this line if you download the
#Prometheus on different path user
ExecStart=/usr/share/prometheus/prometheus \
  --config.file=/usr/share/prometheus/prometheus.yml \
  --storage.tsdb.path=/usr/share/prometheus/data

[Install]
WantedBy=multi-user.target
a . 配置 Prometheus 文件prometheus.yml进行自我监控:
global:
  scrape_interval:     15s # By default, scrape targets every 15 seconds.

  # Attach these labels to any time series or alerts when communicating with
  # external systems (federation, remote storage, Alertmanager).
  external_labels:
    monitor: 'codelab-monitor'

# A scrape configuration containing exactly one endpoint to scrape:
# Here it's Prometheus itself.
scrape_configs:
  # The job name is added as a label `job=<job_name>` to any timeseries scraped from this config.
  - job_name: 'prometheus'

    # Override the global default and scrape targets from this job every 5 seconds.
    scrape_interval: 5s

    static_configs:
      - targets: ['localhost:9090']
启动 Prom ,./prometheus --config.file=prometheus.yml【默认情况下,Prometheus 将其数据库存储在./data中(可以使用--storage.tsdb.path自定义data路径)】
此时打开浏览器,进入localhost:9090查看其自身的状态页,此外你还可以访问localhost:metrics查看其指标参数
简单入门,来自官方文档.
b. 修改 prometheus 配置文件 prometheus.yml:
global:
  scrape_interval:     15s
  evaluation_interval: 15s

alerting:
  alertmanagers:
  - static_configs:
    - targets: ["localhost:9093"]

rule_files:
  #- "alert.rules"

scrape_configs:
  - job_name: 'prometheus'
    scrape_interval:     5s
    static_configs:
      - targets: ['localhost:9090']

  - job_name: 'node'
    scrape_interval:     10s
    static_configs:
      - targets: ['localhost:9100']
该配置文件比较完整,该节点安装了 node_exporter 以及 alertmanager 服务,可以先按照此配置文件做配置,不影响服务的启动过程
启动服务:
systemctl daemon-reload
systemctl start prometheus.service
systemctl daemon-reload
systemctl start prometheus.service
Prometheus 服务启动完成后,可以通过http://127.0.0.1:9090访问 Prometheus 的 UI 界面
安装配置 node_exporter
为监控服务器 CPU , 内存 , 磁盘 , I/O 等信息,需要在被监控机器上安装 node_exporter 服务。
从官方站点下载node_exporter包:
wget https://github.com/prometheus/node_exporter/releases/download/v1.0.0-rc.0/node_exporter-1.0.0-rc.0.darwin-amd64.tar.gz
tar xf node_exporter-1.0.0-rc.0.darwin-amd64.tar.gz -C /usr/share/node_exporter
chown -R prometheus.prometheus /usr/share/node_exporter
wget https://github.com/prometheus/node_exporter/releases/download/v1.0.0-rc.0/node_exporter-1.0.0-rc.0.darwin-amd64.tar.gz
tar xf node_exporter-1.0.0-rc.0.darwin-amd64.tar.gz -C /usr/share/node_exporter
chown -R prometheus.prometheus /usr/share/node_exporter
创建 node_exporter 系统服务启动文件 /usr/lib/systemd/system/node_exporter.service:
[Unit]
Description=Node Exporter
Wants=network-online.target
After=network-online.target

[Service]
User=prometheus
ExecStart=/usr/share/node_exporter/node_exporter

[Install]
WantedBy=default.target
[Unit]
Description=Node Exporter
Wants=network-online.target
After=network-online.target

[Service]
User=prometheus
ExecStart=/usr/share/node_exporter/node_exporter

[Install]
WantedBy=default.target
启动 node_exporter 服务:
systemctl daemon-reload
systemctl start node_exporter
systemctl daemon-reload
systemctl start node_exporter
服务启动后可以用 http://127.0.0.1:9100/metrics 测试 node_exporter 是否获取到节点的监控指标。
使用 Grafana 展示工具
安装Grafana:
wget https://dl.grafana.com/oss/release/grafana-6.7.3-1.x86_64.rpm
sudo yum install grafana-6.7.3-1.x86_64.rpm
wget https://dl.grafana.com/oss/release/grafana-6.7.3-1.x86_64.rpm
sudo yum install grafana-6.7.3-1.x86_64.rpm
启动 Grafana 服务:
systemctl start grafana-server
systemctl start grafana-server
服务启动后 grafana 默认监听在 3000 端口 ,可以通http://127.0.0.1:3000 访问 grafana 的 ui 界面,默认登录账号密码为 admin/admin ,第一次登录需要我们重置密码。
添加Prometheus数据源:
Data Sources --> Add Data Source --> Prometheus
导入模板:
选择左侧菜单栏 + 号 --> import --> 填入id或者json格式数据
ℹ️模板来自:https://grafana.com/grafana/dashboards/8919
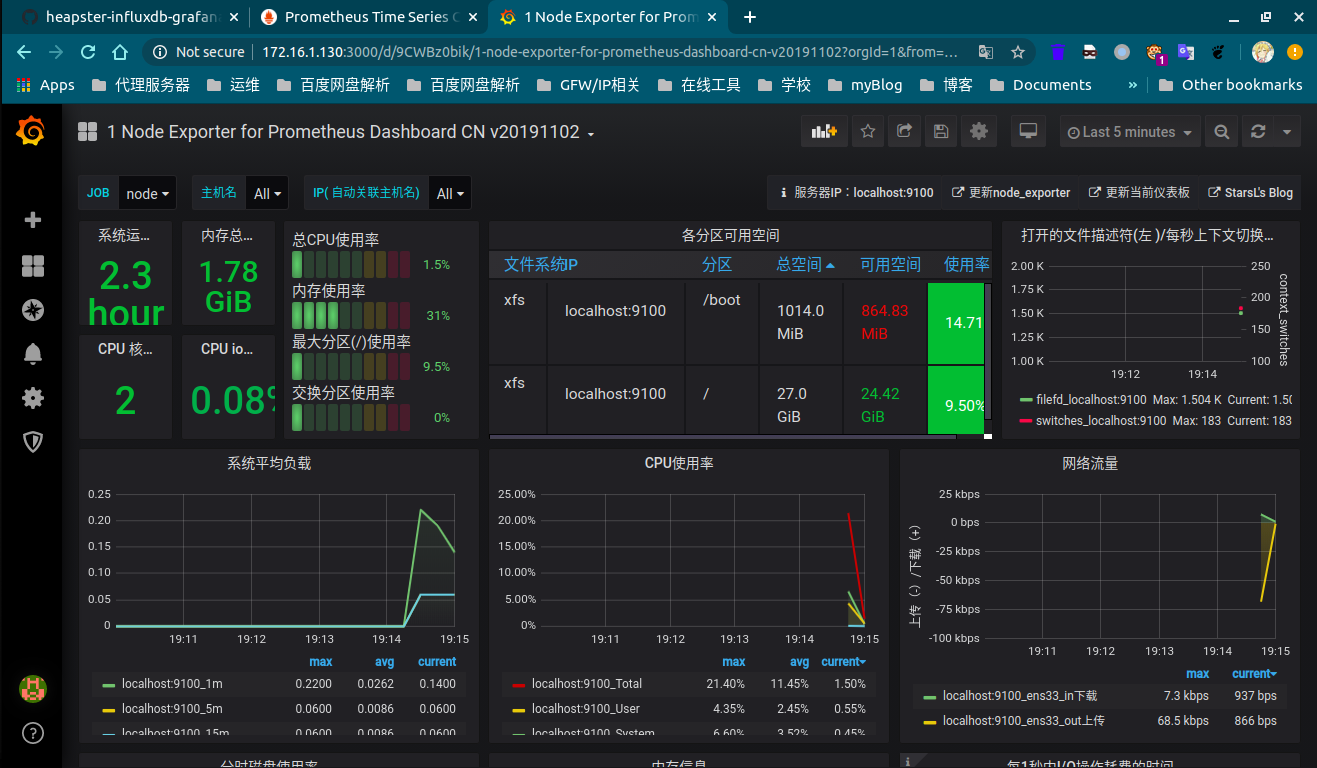
ℹ️ 模板注意事项:
导入看板后,请根据实际情况在看板右上角点击Dashboard settings--Variables设置好变量:
默认已经设置并关联好job,hostname,node这3个变量。(name,env变量是自定义的标签,已隐藏。大家可根据需要自行增加。)
$node取值node_exporter的instance,IP:端口格式。大部分查询关联了这个变量,请确保该变量有效$maxmount用来查询当前主机的最大分区,默认只获取ext4和xfs类型的分区。
⚠️**注意:**所有的监控服务都强依赖时间服务器,要保证服务器客户端和web端的时间一致,否则数据无法正常展示和更新.
参考链接
- prometheus官方文档:https://prometheus.io/docs/prometheus/latest/getting_started/
- grafana 安装文档:https://grafana.com/docs/grafana/latest/installation/rpm/
- 如何导入一个 Grafana 面板:https://grafana.com/docs/grafana/latest/reference/export_import/#importing-a-dashboard
- prometheus 入门进阶:https://yunlzheng.gitbook.io/prometheus-book/